Inventory KPI Dashboards: Showcasing Turnover, Stockouts, Overstocks, Reorder Alerts

Table of Contents
Share On
Managing inventory has evolved far beyond clipboards and spreadsheets. Today, real-time visibility and data accuracy are essential. Businesses in retail, e-commerce, and logistics across MENA and globally are moving toward smarter tools to gain control over their stock. At the heart of this shift is the inventory KPI dashboard—a digital command centre that showcases everything from turnover ratios to reorder alerts.
With the right dashboard in place, companies can avoid costly mistakes like stockouts, overstocking, or delayed replenishment. This isn’t just about keeping shelves full. It’s about boosting cash flow, improving customer service, and staying competitive in a dynamic market.
Let’s explore what makes these dashboards essential, and how they support better decisions through powerful, actionable data.
Why Dashboards Are the Backbone of Inventory Visibility
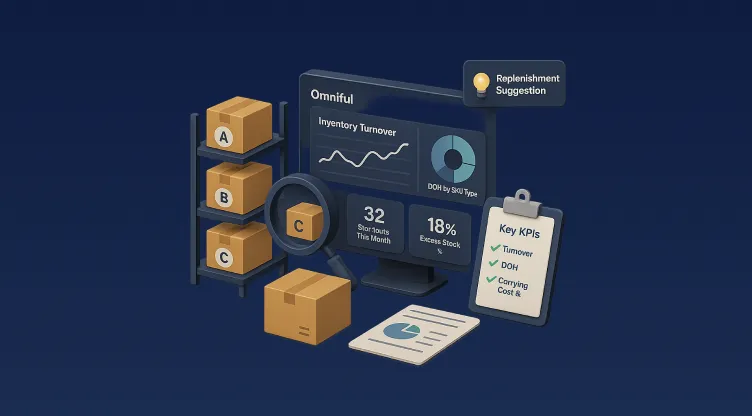
Every business decision tied to stock depends on clear, accurate, and timely information. That’s what an inventory KPI dashboard delivers. Instead of guessing what’s in the warehouse or relying on weekly updates, you get live data at a glance.
These dashboards are especially useful when integrated with warehouse software management platforms. They offer a snapshot of current inventory health, supported by metrics like turnover rates, stock coverage, and SKU-level performance.
By visualising the right key performance indicators (KPIs), managers can react fast, plan ahead, and optimise every touchpoint in the supply chain.
Key Metrics Every Inventory Dashboard Should Include
While dashboards can vary based on the business model and industry, a few core KPIs are vital for nearly every operation.
Inventory Turnover Rate
This shows how often your inventory is sold and replaced over a given period. A higher rate indicates efficient stock movement, while a low turnover suggests excess or slow-moving goods.
The formula is simple:
Turnover = Cost of Goods Sold ÷ Average Inventory
This metric helps identify whether you’re over-purchasing or understocking and supports smarter buying strategies.
Stockouts
No retailer wants to turn customers away because an item is unavailable. Stockout tracking in real-time highlights gaps and helps you react quickly—either by adjusting procurement or reallocating stock from other hubs.
It’s especially crucial in fast-paced sectors like grocery or fashion, where product availability affects brand trust and repeat sales.
Overstocks
Having too much inventory ties up cash and fills valuable space. This KPI alerts you to surplus items, allowing for discounts, bundling, or liquidation before they become dead stock.
Modern stock management tools often use machine learning to predict slow movers and avoid unnecessary reordering.
Reorder Alerts
Reorder points are thresholds set for each product. When stock falls below this point, the system sends an alert. Smart dashboards allow you to automate this process, reducing the chances of human error and maintaining healthy inventory levels.
Reorder alerts are particularly useful in high-volume environments where managing each item manually becomes impossible.
Visualising KPIs for Clarity and Speed
The beauty of an inventory dashboard lies in its simplicity. With colour-coded alerts, graphs, and tables, it translates raw data into visuals that any team member can understand.
For instance:
- Red icons for stockouts
- Green for well-stocked items
- Yellow when stock is near its minimum threshold
This kind of visual hierarchy allows warehouse teams, procurement managers, and finance leads to stay aligned without deep dives into spreadsheets.
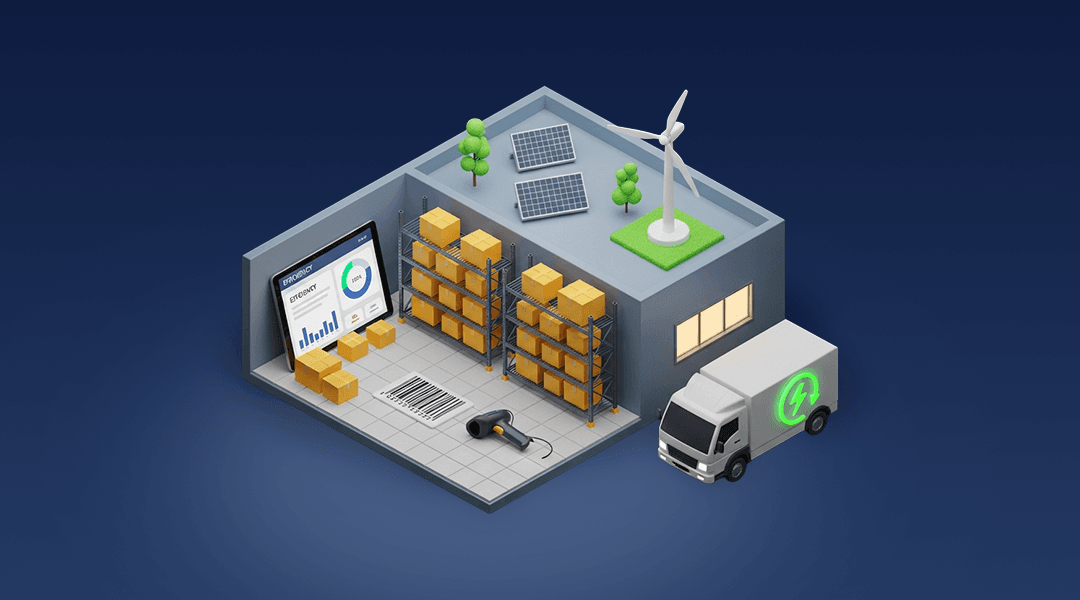
Integrating Dashboards with Warehouse Software Management
An effective dashboard doesn’t stand alone. It works best when fully integrated with a warehouse software management system that handles everything from inbound shipments to returns.
When these tools are synced, data flows automatically. A sale made online reflects instantly in the stock count. A returned item updates inventory levels without delay. A near-expiry product triggers a notification to discount it.
This level of automation allows your business to scale while reducing risk and labour costs.
Free Inventory Management Software: Is It Worth Considering?
For startups and small businesses, budget matters. That’s where free inventory management software becomes attractive. While it may not offer all the features of enterprise-grade tools, it often includes basic dashboards that display essential KPIs.
Popular platforms like Zoho Inventory, inFlow, and Odoo provide free tiers with customisable dashboards, SKU tracking, and reorder alerts. They’re a good starting point for those transitioning from spreadsheets but might fall short when handling large SKU volumes or multiple warehouses.
For growing businesses in the MENA region, investing in a scalable solution like Omniful ensures you’re ready to handle more complex logistics, multiple sales channels, and higher order volumes.
Benefits of Using KPI Dashboards Across Teams
Inventory dashboards aren’t just for warehouse managers. They benefit every department:
- Operations: Identify bottlenecks and make informed replenishment decisions.
- Sales: Understand which products are under or overperforming.
- Finance: Monitor inventory value, shrinkage, and liquidity tied to stock.
- Customer Service: Track product availability to avoid promise failures.
When everyone works from the same real-time dashboard, alignment improves, and so does decision-making.
Localising Inventory Management for the MENA Market
For businesses operating in Saudi Arabia, the UAE, and other parts of the Middle East, it’s important that dashboards cater to local logistics norms. This includes:
- Multi-language support (English and Arabic)
- Units of measure suited to regional trade (litres, kilograms, etc.)
- Expiry tracking for food and pharma
- Integration with local shipping providers
Warehouse software platforms like Omniful, built with MENA market conditions in mind, help regional businesses stay compliant, competitive, and efficient.
The Role of AI and Automation in Inventory Dashboards
As inventory systems evolve, artificial intelligence is playing a bigger role. AI-powered dashboards don’t just show you the data—they interpret it, forecast future trends, and even recommend actions.
For example, based on historic sales and current trends, an AI system might:
- Suggest stock redistribution between locations
- Recommend early reorder for trending SKUs
- Alert for items likely to expire before sale
These insights are invaluable for teams that want to be proactive rather than reactive.
Mobile-First Dashboards: Managing Stock on the Go
In a region where mobile adoption is high, having inventory dashboards accessible via smartphones or tablets is a game-changer. Whether a store manager is on the shop floor or a fulfilment supervisor is offsite, mobile access keeps decision-makers informed and agile.
Dashboards that work well on mobile apps also make it easier for staff to update counts, process returns, and receive alerts instantly—no matter where they are.
Building Custom Dashboards for Specific Business Needs
Every business has unique priorities. A fashion brand may care more about style-based stock turnover, while a pharmaceutical supplier may focus on batch tracking and expiry alerts.
That’s why modern dashboard tools allow for custom views. Choose your KPIs, set alert thresholds, and decide how the data is displayed—by region, SKU, channel, or timeframe.
Customisation ensures the dashboard aligns with your goals, not the other way around.
Making the Case for Smarter Inventory Dashboards
In a world where margins are tight and customer expectations are high, data can’t be an afterthought. Inventory KPI dashboards empower businesses with the insights they need to thrive.
By combining turnover data, stock alerts, and real-time analytics into one platform, these dashboards remove the guesswork from stock management. They support leaner operations, reduce waste, and allow businesses to adapt quickly—especially in the dynamic markets of the Middle East.
Want to Get Started with Better Inventory Insights?
📊 Explore Omniful’s Warehouse Dashboard
See how our intelligent platform brings all your inventory metrics into one clear, easy-to-use interface. Built for MENA. Powered by data. Ready for scale.
FAQs
Can free inventory management software support dashboards?
Yes, many free tools offer basic dashboards, though advanced features may be limited.
Which KPI is most important in inventory management?
It depends on your goals, but inventory turnover, stockouts, and reorder points are critical for most businesses.
Do dashboards help with demand forecasting?
Absolutely. Many dashboards visualise past sales and help predict future stock needs.
Are dashboards useful for small warehouses too?
Yes. Even basic dashboards help small teams make faster and smarter inventory decisions.
Is there a mobile-friendly dashboard option?
Most modern platforms offer mobile access, allowing teams to view and act on data anytime, anywhere.